Sounding What Lies Below
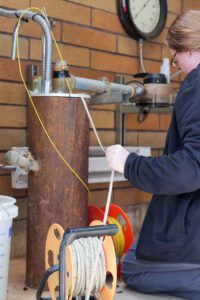
Hydrogeologist, Cheyenne Stice sits calmly on a small folding chair amid a torrent of mechanical noise. The sound of a pump motor fills the cramped 7-foot by 7-foot pump house nestled beside the new Quilcene water tank. Stice pays no heed to the sound, instead focusing on the water level sensor she has lowered into a large pipe projecting from the pumphouse floor.
Pump tests provide critical feedback on the finite groundwater resources underfoot. Data collected helps utility and state water resource teams better manage your water.
Over the next 24 hours, Stice, with help from PUD Water Distribution Manager II, Doug Reeder, will conduct various tests, probing the 165’-deep well for critical aquifer data.
Water moves through aquifers at varying speeds until it discharges into the saltwater of the Puget Sound and the Strait of Juan de Fuca. PUD wells capture this water for use. Aquifer data from the pump test help managers provide evidence for how many homes a source can serve and ensure that all other water right holders can get their state allotted rights. In the case of Quilcene, that includes the state instream flow rights to protect the Big Quilcene River.
Measuring well performance can be done a multitude of ways. Two test are carried out in Quilcene including what is known as a “step test”, and a 24-hour pump and recovery test.
The step rate test leads off to show water level data as the well pump is set to different gallon-per-minute flow rates.
Stice places a water level sensor or “sounder” into the well pipe. The sounder is part of a long graduated tape which, when contact with water is made, makes a circuit causing a light to illuminate and a small buzzer to sound. The sounder plunges into darkness, finally stopping at 42’ when the red light flashes. That’s the base line water level.
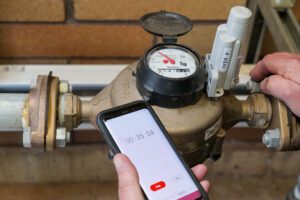
Reeder, using a mobile app, engages the well pump and manually throws a lever to allow water to flow at a specific rate. Reeder and Stice synchronize watches and the test begins.
“Right now, it’s pulling about 24 gallons per minute,” Reeder said as he glances between the timer and a spinning flow meter on the water line extending from the well.
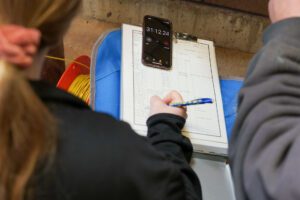
Beside him, Stice moves intentionally, lowering the sounder again until the red indicator light flashes at a new, deeper level. She writes the data at 30-second intervals.
“Eventually, it will level off at this pump speed and we will go to the next step until we get to about 40 gallons per minute,” Stice said.
It’s amazing how much water flows beneath our feet 24/7/365. Not every well across the county can handle this pumping rate, with some private wells pulling water at rates so low they require supplemental storage. Well location matters when you are a peninsula on a peninsula, like many of the PUD’s systems.
Water levels continue to drop. At 34 gallons per minute the indicator reads 104’—a 62’ drop from the start of the test only 38 minutes earlier.
Eventually the water levels out, signaling the water moving underground is in-step with the pumping speed. Once they reach 40 gallons per minute of pumping speed, and a stable baseline is reached, the 24-hour clock begins. The pump will run for 24 hours straight, with Stice taking measurements three times during that time.
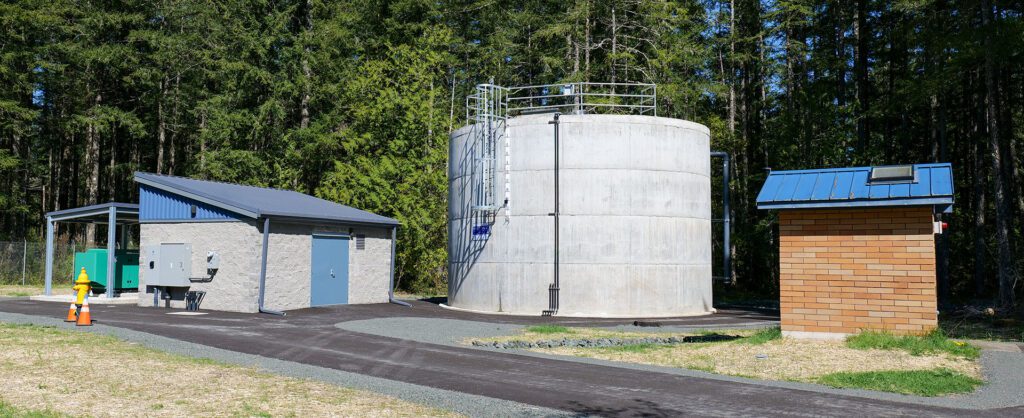
Water pumped during testing goes directly into the new 105,000-gallon concrete tank beside the pump house. PUD staff lowered the tank level to account for the extra water produced during the pump test to avoid waste.
“It’s a good opportunity to run fire hydrants and flush the system because of all the excess water,” said Reeder.